The Heartland Hedging Process
“Living with what the market is giving you today and preparing for any market event that may occur.”
Current Scenario
| Inputs | ||
| Corn Acres Planted | 1000 | |
| APH for Insurance | 200 | |
| Insurance Percentage | 80% | |
| Current Cash Sale % | 0% | |
Calculating the Insurance Threshold

Calculating Current Estimated APH Revenue
The Mark to Market
| With Yield APH of: | 200 |
| Total Anticipated BU’s: | 200,000 |
| Ins Rev Calculation | 980,000 |
| With Ins Ind Threshold of 785,400 the potential Ins is: | 0 |
| Remaining BU exposed to market movement: | 200,000 |
| Revenue on those bushels at current market: | 878,000 |
| Any futures options gain or loss: | 0 |
| Current estimated revenue at APH: | 878,000 |
THIS IS WHERE YOU ARE AS OF TODAY! WHETHER YOU LIKE IT OR NOT, THIS IS WHAT THE MARKET IS GIVING YOU. NOW, LET’S LOOK AT THE FUTURE
Markets go up and markets go down the ZCZ26 Chart
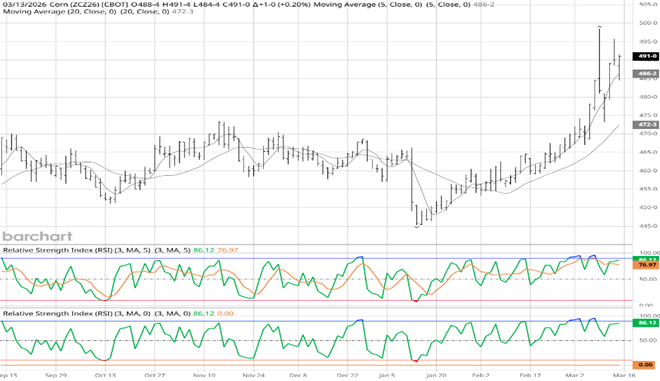
HOW DOES THIS VOLATILITY IMPACT REVENUE?
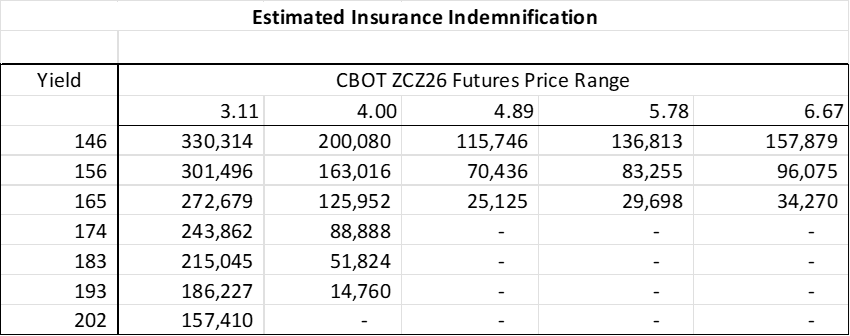
Reading the Matrix:
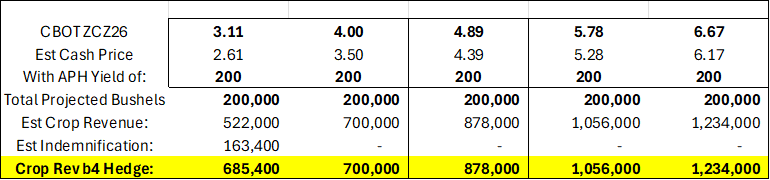
The current revenue is $878,000. Yet if the market were to head back to 4.00 futures, your revenue would decrease to 700,000. If the market declines to 3.11, your anticipated revenue would “bottom out” at $685,400 because your estimated insurance indemnification comes into play.
The next step in Grain Revenue Management is building a matrix providing a summary of anticipated revenue over an array of prices and yield changes. The revenue calculations are based on estimated insurance indemnification and estimated revenue on the sale of the remaining bushels at the stated futures price:
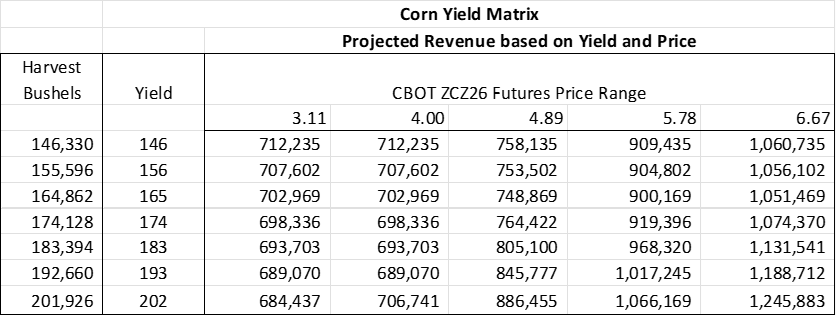
The most dynamic component of revenue? Insurance Indemnification.
WHERE DOES THAT LEAVES US?
These matrices demonstrate a small sample of our proprietary system that will help you become a revenue manager rather than a market speculator. As a grain revenue management consulting firm, we review the array of different revenue scenarios that may affect you. We determine from you what your expectations and tolerance to revenue volatility may be.
In this case our discussion with you might go like this:
- Your current revenue is $878,000. Where does this fit in with your budget and expectations? Good or bad, this is our starting point moving forward.
- Revenue management is the process to mitigate risk to adverse price movement throughout the growing season. Currently, you have $178,000 of revenue at risk before 85% RP may kick in. Are you willing to live with this risk? We are not asking you the probability of this event occurring. Are you willing to live with the result should this happen?
- We can then work with you in understanding what the options may or may not due as you begin your journey on Grain Revenue Management.
What Else Heartland Offers
- Weekly reporting showing your mark to market revenue, and revenue changes in time and changes in market prices;
- Shock analysis of revenue based on all factors that contribute to gross farm revenue: Cash sales, insurance, and futures and options hedges;
- Reconciliation of futures account equity to hedges by crop by year.
Heartland Commodities and Securities Inc. is a National Futures Association registered Guaranteed Introducing Broker. John Ohman is a 30 plus year veteran of building hedge modeling to assist in quantifying financial risk across many industries. Some say he is a “hedgeaholic”. His models have been used for oil and gas, bond portfolio management, managing risks for mortgage originators, and grain producers. Today, his grain revenue management models can apply to any size farmer, large or small, to generate updates quickly.
There is significant risk involved in trading futures and/or options on futures. Futures and/or options of futures trading may not be suitable for all investors. Investors should consider these risks and evaluate their suitability based on their financial conditions. Past performance is not indicative of future results.